Does growth happens proportionately?
We know you want to start scaling. You are starting to see some things working and they are resulting in top-line revenue growth. But the intentional injection of resources into the top of your sales and marketing funnel is not moving opportunities through the way you .
As you pull apart and dissect each stage of the marketing funnel, none of the experiments apply seem to work. The blogs and YouTube videos that impart SaaS growth wisdom aren’t working. I know. You were hopefully they would.
You rationally might believe marketing is the problem. Not the right content, not the right ads, not the right website, and on and on. But to make one or more of these right will be too costly for you.
Breathe. I’ll explain what’s going on with this essay and what you can do to get out from under this.
You have fundamentally overestimated what your business can produce, how opportunities are moving through your funnel, and which of your customer segments are actually ready to scale. You may believe your whole business is working, but it is not. Read on.
I repeatedly hear from SaaS founders and CEOs who are moving into a scale motion that their overall numbers look good. And they are right (and you’re right). The overall number does look good, but the underlying way of doing business won’t give you scale. Time and time again they assume the business is working as they deploy a meaningful amount of capital toward customer acquisition only to find the harvest yields little fruit.
Growth does not happen proportionately.
New Logo Acquisition Framework
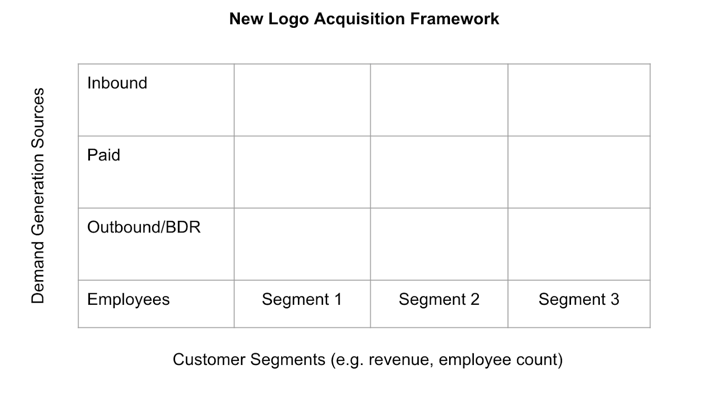
Scaling doesn’t happen proportionately so you need to dissect your business. We will use what I call the New Logo Acquisition Framework. Let’s look at a blank framework.

This framework is your business just zoomed out a little. The framework helps you see what overall customer base is made up of (Customer Segments) and what marketing efforts they come from (Demand Generation Sources). We’ve now set up your one business as nine different business units. You can now see the variance in the performance by lead sources/customer segments. Don’t worry, we won’t be doing any complicated math today.
It’s critical to understand which sources and segments are healthy and which are not to avoid the unintended consequences that can cause a business to fall apart. Imagine you continue to deploy capital quarter after quarter in any one of the boxes and it’s been deemed not working.
Now that I have given a basic understanding of the framework let us get granular and apply it. First, a decision needs to be made on a customer segment approach (i.e. customer size, vertical, etc.). The question to ask yourself, or pose to your team is: what are some things about all of our successful customers that they have in common? You’re not looking for perfect, you’re just attempting to get a beta version of this framework. Examples of segments include employee count and revenue.
For demand generation sources no questions here, just lay them out as Inbound, Paid, and Outbound/BDR (as the framework suggests).
To determine whether the business in each box is successful look at your customer base by segment and source. Does your data suggest anything? If you have weak, or limited data ask your team. Get marketing, sales, support in a room and ask them where things are working and where they aren’t. Apply your newly gained knowledge to each box in the grid.
By saying “successful” you are documenting on the framework that customers within this segment/source combination are retaining and spending more with you. Mark these boxes green. For the segments where customers are not successful decide whether to run an experiment or ignore, for now. You may wish to experiment everywhere it’s not working. Only do this if you have the resources to experiment and can get the data back from the experiments fast enough.
Dissecting both axes reveals the two truths about your business:
- Not all customers come from the same marketing channel
- Not all customers are created equal
One of the things we share for new students, or clients that we onboard is we share our frameworks and provide homework. Feel free to reach out to us so get the New Logo Acquisition framework.
If you wish to continue, let me walk you through how RevPipes works on this with clients.
Real application of framework

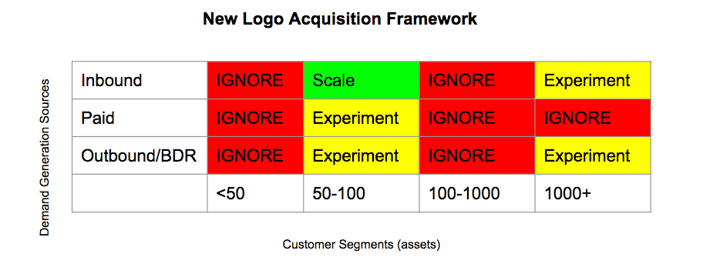
Above is an example of a New Logo Acquisition Framework applied to a SaaS business that I helped. The team took this knowledge and leveraged it to grow 15 consecutive months, achieve their first $1MM month in record time, and complete a successful fundraise.
The client segmented their business by the number of specific assets a customer has. While the client debated customer size, employee size, and number of assets they settled on assets. They selected “number of assets” because marketing, sales and customer support aligned their teams based on size/pricing and size depended on assets more so than employee count.
Let’s go through each of the boxes.
- A quick observation was made that the client did not want more customers with less than 50 assets. The part-time CFO had identified revenue from this segment was not healthy. For now we will IGNORE this segment.
- It was not clear on our first pass how to segment the remaining segments so we took our best guess and came up with 50-100, 100-1000, 1000+. These were generally agreed upon. Remember this is our first pass at this exercise. We’re looking for better, not perfect.
- The team shared the 50-100 segment was a sweet spot because Inbound was working, clients were staying, and there was a large market in that segment. We will SCALE this segment.
- Client decided to ignore the 100-1000 segment as they wanted to see if scale with Inbound would expand in this segment experiments in the 50-100 segment would solve it (maybe the 100-1000 segment wasn’t necessary)
- Client decided to ignore PAID efforts for 1000+ segment as they didn’t have bandwidth.
This made it easy to determine which sources/segments to ignore. Of the remaining, only one box was really working and required Scale resources. We now knew where to invest heavily with capital and resources (allowing us to create very specific job descriptions) and where we wanted to experiment. We also set the customer segments as assumptions so each week the framework would be challenged as new learnings emerged.
The team felt really good about this. They would invest resources where they knew things were working so the numbers overall would still grow and they would experiment in the areas they deemed they should to get things turned around and working so they could scale.
Going through this exercise will teach you more about which customers are successful.. It will teach you how the three main sources of demand generation are feeding your business. It will also teach you where you might be placing too much stress on the business at the moment and create focus.
We hear time and time again the relief from Founders and CEOs after we have run them through this. They consistently claim they have better clarity and their teams have better focus and understand what the business is attempting to do.
Most of them just don’t know to take one more step, dissect their business, and look at their business as 4-9 different business units. While the benefits for growth are clear the feedback from other executives and members of the team is glowing as alignment becomes tighter and clarity of focus increases.
Conclusion
It's critical to look at your business through the lenses of demand generation channel and customer segment. A New Logo Acquisition Framework helps you do just that which clarifies how you can best deploy resources and capital to accelerate the revenue for your B2B software company.
